
If you’ve read part 1 of our article on sales velocity, hopefully we’ve convinced you why it is such a simple yet critical measure of the health of your business.
In part 2, we will introduce some other important sales measures and using these to show how to calculate a ‘velocity-based forecast’ – a forecast of sales generated from new business over time.
We’ll also explain how a CRM such as HubSpot or Pipedrive can help calculate this.
A quick recap – what is sales velocity?
Sales velocity is a measure of how fast your business is winning new deals. A higher sales velocity means you’re bringing in more revenue in less time.
The quicker you can grow your pipeline and convert prospects into paying customers, the more successful your business will be – simple!
Limitations of the sales velocity metric
Whilst sales velocity metric is a useful tool for any business, there are a couple of additional considerations that can help unlock its real value.
Here’s a couple of limitations to be aware of:
1. It takes time to convert a lead to a deal to a closed sale. If you start selling today but it takes you 6 months to close a deal, you won’t see any new sales for six months.
2. A sale is often something delivered over a period of time. A consultancy project or a recurring licence all have a start date, a duration and an end date.
Some deals can be delivered on the day they are won, but what if they aren’t? If you care about revenue recognition, recurring revenue (MRR/ARR) or maybe cashflow more than deal close dates, you need to factor in deal length.
Introducing two new components of sales velocity forecasting
Let’s look at the two new measures we will require in a bit more detail and consider how they can be exported from your CRM.
- Time to convert (‘Tc’) – the average number of months it takes for prospects to move through your sales stages. In your CRM, start with just the won deals that have closed in the period you are interested in and calculate the average difference between create dates and closed dates.
- Deal length (‘Dl’) – the weighted average duration of a deal from when it is won (or when delivery actually starts) until all of the revenue has been earned. This is used to take into account the fact that there might be a relationship between deal value and deal duration. Duration data isn’t captured in most CRMs by default, but it is worth adding a custom deal property to start record this metric duration.
To calculate the weighted average deal length, start with the won deals that have closed in the period you are interested in then, take the value for each deal, multiply by the duration for each deal, calculate the sum total of these value-x-duration amounts and divide by the sum total of the deal value. And you’ve got it!
Calculating your sales velocity forecast
Your sales velocity forecast is a calculation of sales by month from new sales, i.e. from sales opportunities that are not yet in your sales pipeline.
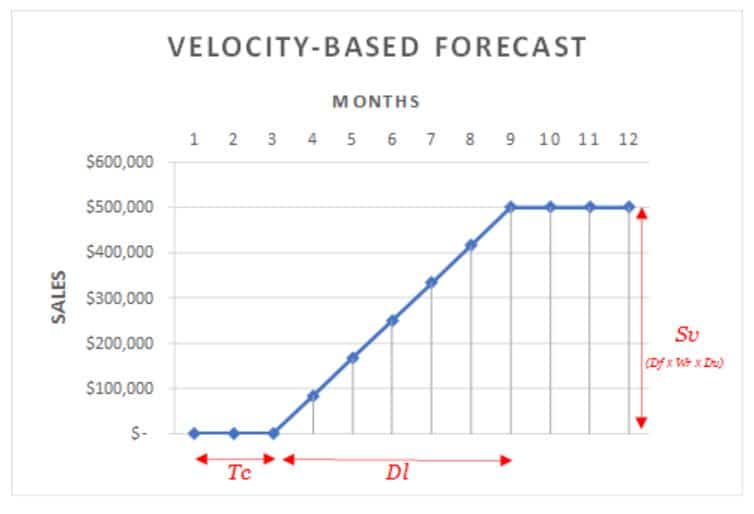
The forecast calculation is illustrated in the diagram below where ‘Vbf’ is the actual velocity-based forecast amount for each month’s sales.
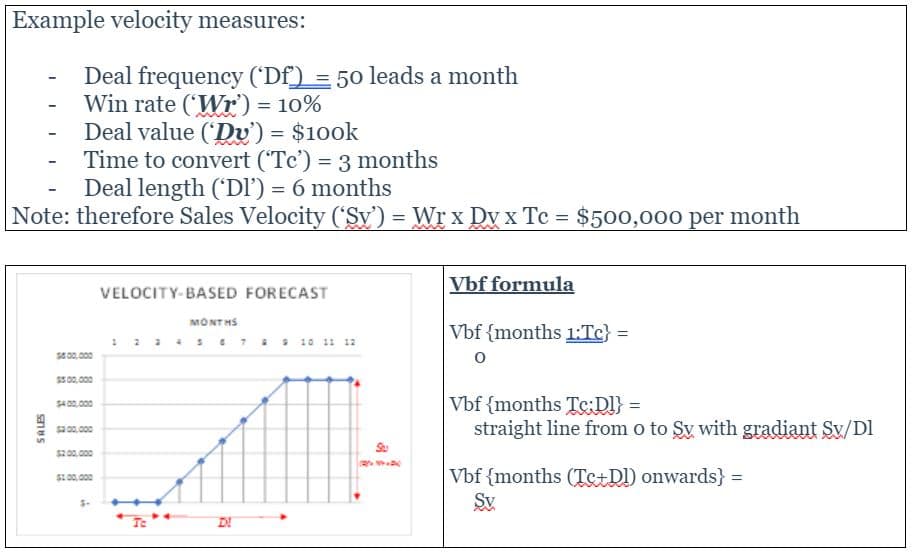
Yes, the formulas look a little scary, but just look at how simple that graph is!
Sales added from today take time to convert, so the velocity-based forecast is zero.
Once sales start closing, they keep closing at a constant rate because opportunities the sales team added ‘Tc’ months ago are closing. If ‘closed won’ sales could be delivered instantly (i.e. if deal length ‘Dl’ was zero) then your forecast would step straight up to the maximum sales velocity (Sv).
The deal length measure (‘Dl’) takes into account sales duration, so one month after the first deals are won, they are still ongoing as new deals get added. The sales forecast therefore grows at a constant rate for a period of time.
This growth continues until ‘closed won’ deals start reaching the end of their delivery duration, which obviously happens ‘Dl’ months after the first closed won deals. From this point, deals finish as fast as they start and the velocity-based forecast reaches a plateau at the maximum sales velocity (Sv).
Isn’t there more to it?
Well, yes and no.
Yes, the velocity–based forecast is a great way to understand how your sales velocity is likely to affect your future business. In the end, it’s just a forecast and things will inevitably turn-out differently, but it can be a very powerful tool in running and planning your business.
In reality, you also need to remember that the velocity-based forecast is based on two key assumptions. 1 – sales velocity remains constant and 2 – you can rely on averages.
However, you can factor in changes to your sales velocity over time but you won’t get a simple forecast ramp that’s much more complicated to calculate.
Velocity-based forecasting is just about simple enough to calculate and use. It’s critical for any metric you might want to share across your business, so we recommend that a velocity-based forecast is used mainly as a scenario-planning tool to help you focus on the key priorities.
Why not give it a try? Calculate your sales velocity, prepare your first velocity-based forecast. Work out what would happen if you could add some more sales power, push–up your prices or accelerate the sales process. You might be surprised by the results!
A short-cut to all the answers
Did you know, these valuable sales velocity metrics are all automated in the QuarterOne app?
If you use HubSpot or Pipedrive, you can connect for free and QuarterOne will do all calculations for you. A great way to get even more value from your CRM!
